Introduction
Welcome to the lab 10. In this session, the following topics are covered:
- Different deployment strategies for the Kubernetes applications;
- First steps in using operators.
Deployment strategies
For upgrade strategy practice, we shall follow an excellent tutorial partially replicated and adjusted here for convenience of following.
First, let's review what common strategies exist in the first place.
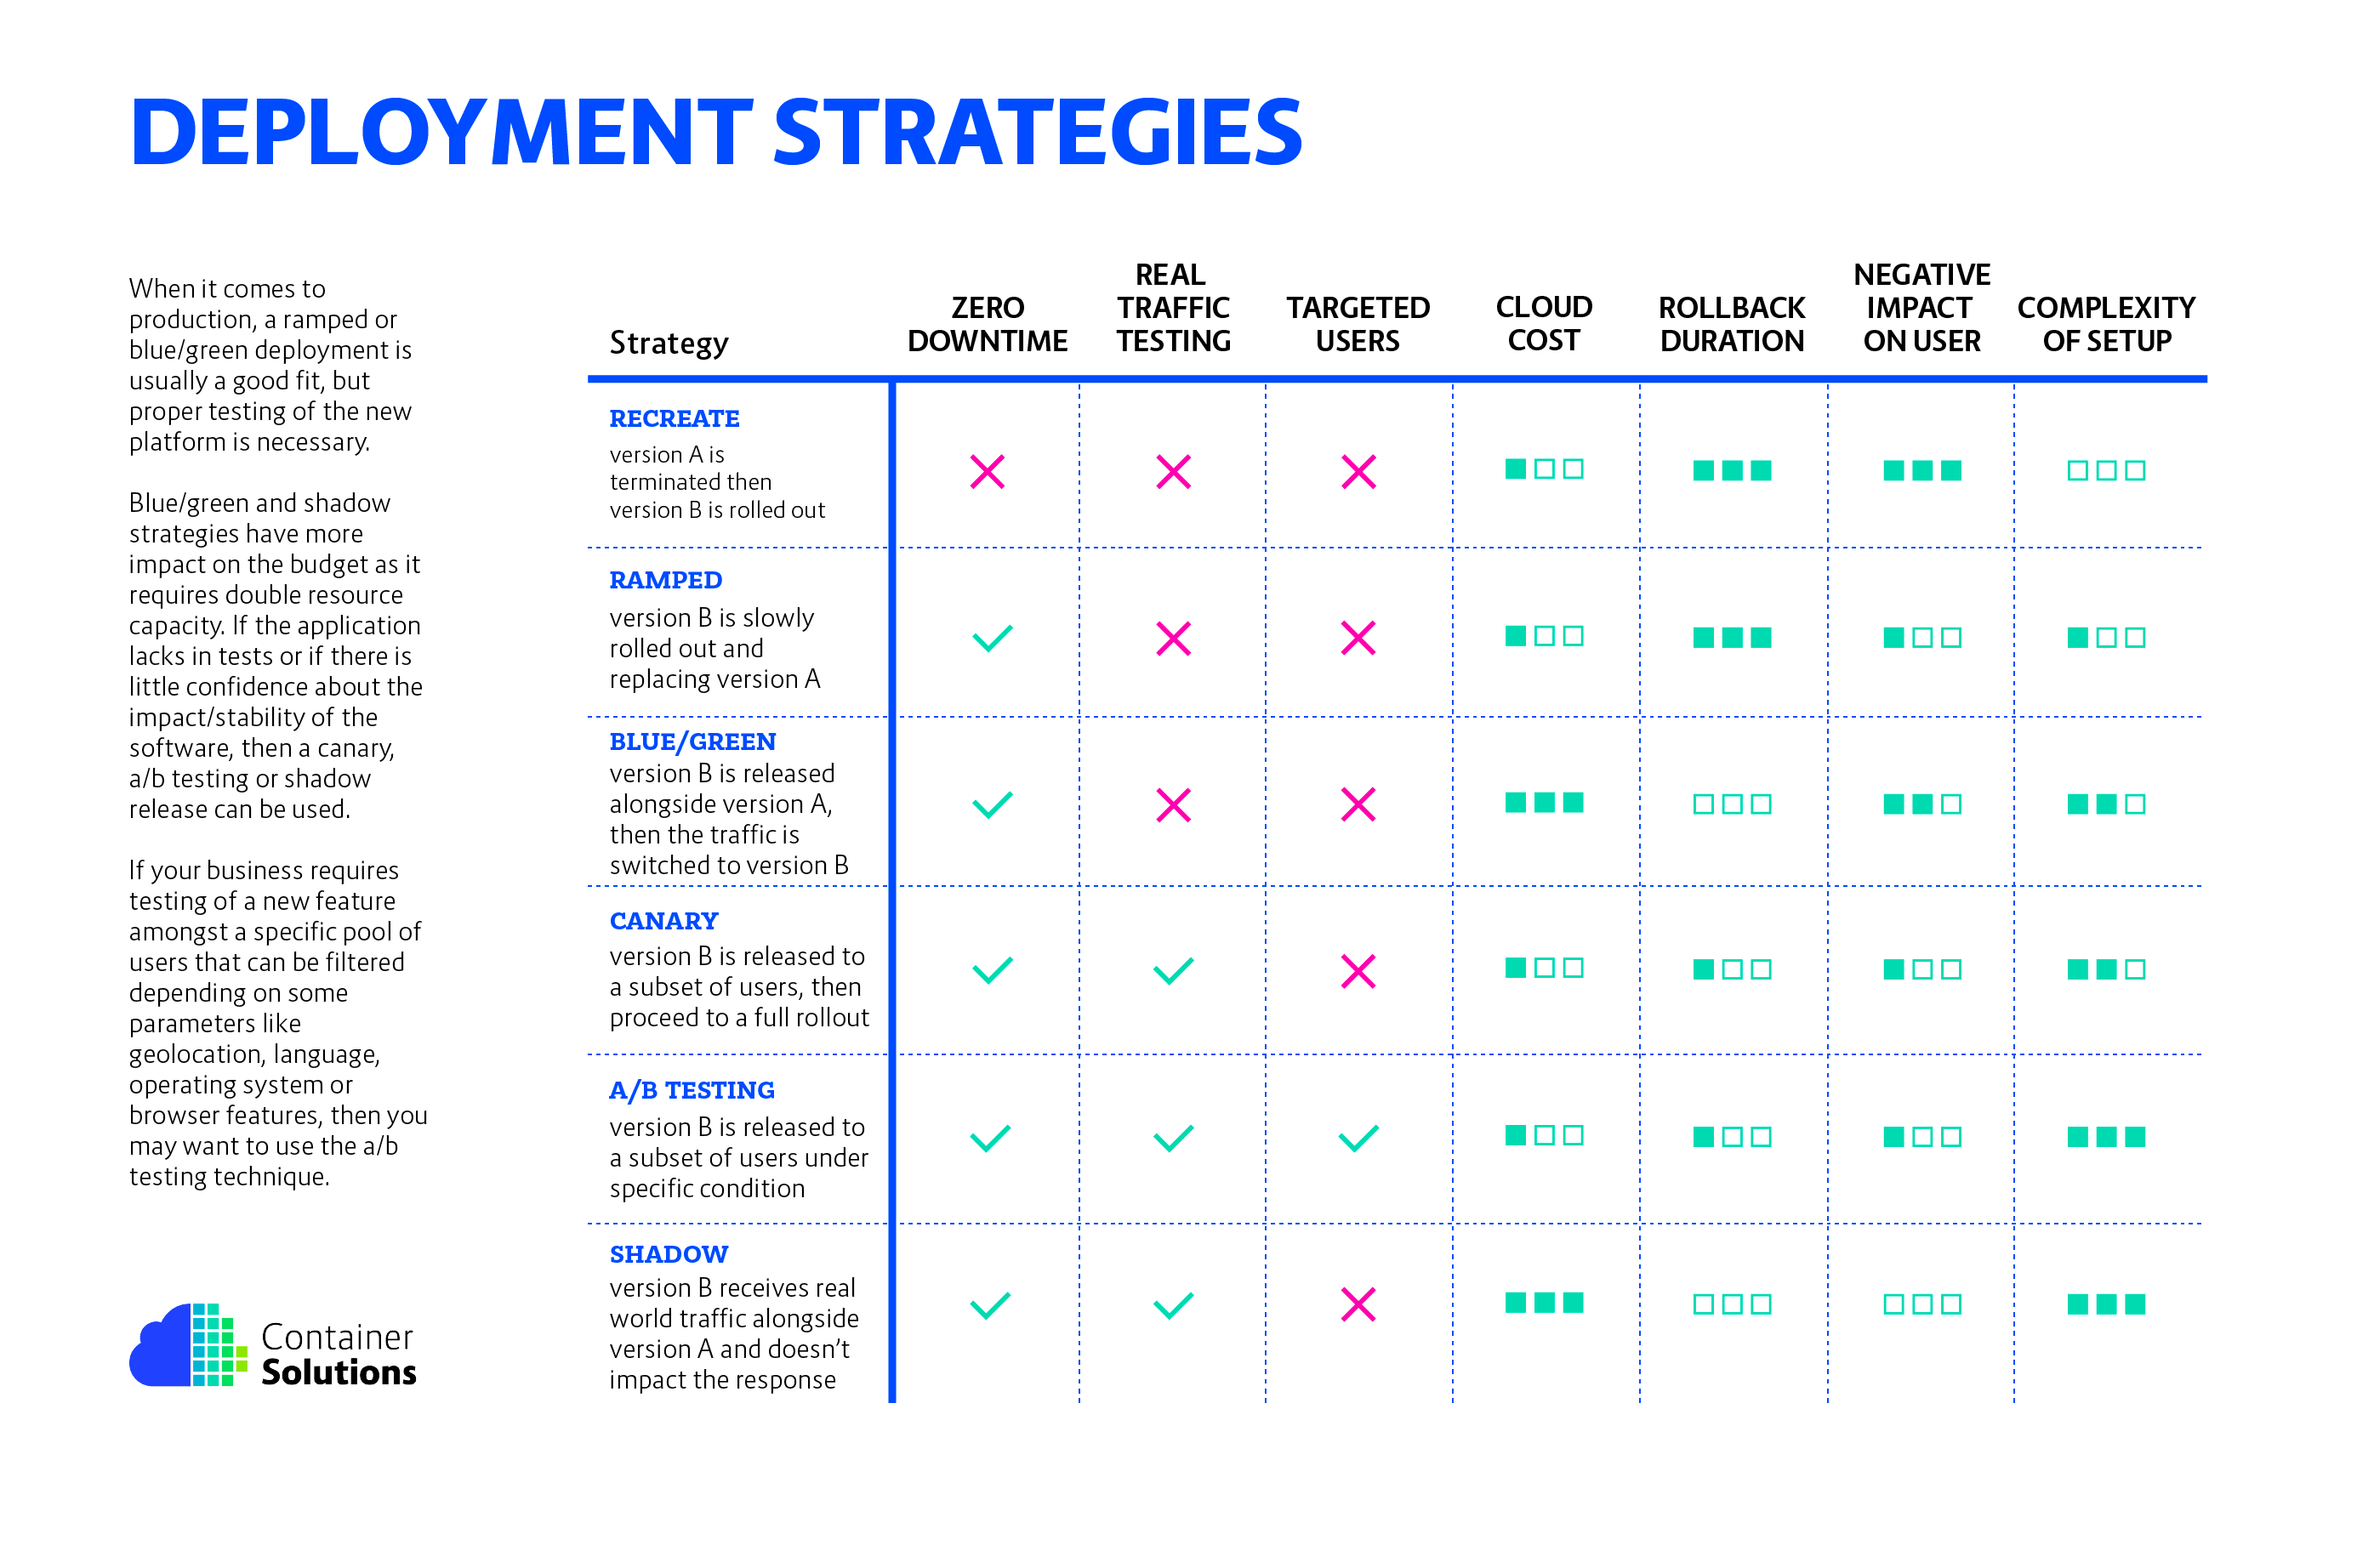
- recreate: terminate the old version and release the new one;
- ramped: release a new version on a rolling update fashion, one after the other;
- blue/green: release a new version alongside the old version then switch traffic;
- canary: release a new version to a subset of users, then proceed to a full new deployment;
- a/b testing: release a new version to a subset of users in a precise way (HTTP headers, cookie, weight, etc.). This doesn’t come out of the box with Kubernetes, it implies extra work to setup a smarter load-balancing system (Istio, Linkerd, Traeffik, custom NGINX/HAproxy, etc);
- shadow: release a new version alongside the old version. Incoming traffic is mirrored to the new version and doesn't impact the response.
Monitoring setup and demo application.
We are going to reuse Prometheus and Grafana applications deployed in Lab 9 for monitoring impact of different deployment strategies and load a custom dashboard for tracking demo application request processing. Make sure that dashboard is using existing Prometheus data source. After import it uses a hard-coded data source identifier, so you need to update dashboard and set a correct one.
Danger
If your Prometheus deployment is having issues, it may have ran out of storage space. In that case, you may need to increase the Prometheus persistent storage size and set up a smaller (Like 75% of size value) storage retention size parameter.
Complete
Create a new custom Grafana dashboard by creating a new empty dashboard and overwriting it's JSON to the following custom dashboard JSON. Make sure that dashboard is using an existing Prometheus data source. If you run into issues when importing, change the version number (for example, to 1), and you can also try changing the uid. If you keep the current uid, it is possible a second new dashboard is created instead of modifying your newly created one.
Verify
Check that a new Grafana dashboard with name k8s-deployment-strategies dashboard was created.
Info
We are going to observe changes in processing of user request by different application versions, so the main Prometheus query will be something like the one below. You can tune period (20s in example) for more fine-grained statistics.
sum(rate(http_requests_total{app="my-app"}[20s])) by (version)
A demo application is an echo server exposing additional endpoints for serving Prometheus metrics and live and readiness endpoints. Please check the code of the demo application as well. Demo application accept environment variable VERSION that emulates version of the application.
Complete
Make sure that you have grafana with a custom dashboard deployed in your Kubernetes cluster.
We are going to collect metrics from a demo app and need to add support for annotations to our Prometheus cluster. For that, please add another job to Prometheus configuration, that will allow triggering discovery by using the scrape annotation.
      - job_name: 'kubernetes-pods'
        kubernetes_sd_configs:
          - role: pod
        relabel_configs:
          - source_labels: [__meta_kubernetes_pod_annotation_prometheus_io_scrape]
            action: keep
            regex: true
          - source_labels: [__meta_kubernetes_pod_annotation_prometheus_io_path]
            action: replace
            target_label: __metrics_path__
            regex: (.+)
          - source_labels: [__address__, __meta_kubernetes_pod_annotation_prometheus_io_port]
            action: replace
            regex: ([^:]+)(?::\d+)?;(\d+)
            replacement: $1:$2
            target_label: __address__
          - action: labelmap
            regex: __meta_kubernetes_pod_label_(.+)
          - source_labels: [__meta_kubernetes_namespace]
            action: replace
            target_label: kubernetes_namespace
          - source_labels: [__meta_kubernetes_pod_name]
            action: replace
            target_label: kubernetes_pod_name
Do not forget to restart Prometheus deployment to apply changes! Also, make sure you apply it in monitoring namespace!
kubectl rollout restart statefulset prometheus -n monitoring
Info
Make sure that your Prometheus deployment is working and disk is not full.
kubectl logs -n monitoring prometheus-0 --tail 50
# check if you see any message about disk being full
If disk is full, one approach is to extend it.
- Access Longhorn frontend;
- Make sure that PV for Prometheus is in a healthy state. Reduce replica count for the PV to the number of nodes in Longhorn.
- Extend volume by 1 GB.
Recreate strategy
The first strategy is very straightforward. To upgrade a deployment, we first remove old and then add a new one.
Let's first deploy a v1 app and wait for it to finish loading. Please note that we create 3 replicas of a service, and we shall deploy it on a NodePort service - dedicate the host port 30111 for this.
apiVersion: v1
kind: Service
metadata:
  name: my-app
  labels:
    app: my-app
spec:
  type: NodePort
  ports:
  - name: http
    port: 80
    targetPort: http
    nodePort: 30111
  selector:
    app: my-app
---
apiVersion: apps/v1
kind: Deployment
metadata:
  name: my-app
  labels:
    app: my-app
spec:
  replicas: 3
  strategy:
    type: Recreate
  selector:
    matchLabels:
      app: my-app
  template:
    metadata:
      labels:
        app: my-app
        version: v1.0.0
      annotations:
        prometheus.io/scrape: "true"
        prometheus.io/port: "9101"
    spec:
      containers:
      - name: my-app
        image: containersol/k8s-deployment-strategies
        ports:
        - name: http
          containerPort: 8080
        - name: probe
          containerPort: 8086
        env:
        - name: VERSION
          value: v1.0.0
        livenessProbe:
          httpGet:
            path: /live
            port: probe
          initialDelaySeconds: 5
          periodSeconds: 5
        readinessProbe:
          httpGet:
            path: /ready
            port: probe
          periodSeconds: 5
Please save the configuration from above as app-v1.yaml. Let's create a service and a deployment and wait till they are working.
After that, let's generate some basic load on the system (replace k8s_node_ip with IP of your Kubernetes node). Let the generator run during the whole time in a separate shell.
for i in `seq 100000`; do curl -m 1 http://k8s_node_ip:30111/; sleep 0.1; done
Now create a copy of the application manifest, for example app-v2.yaml, change manifest and set VERSION variable to v2.0.0 and app version label to v2.0 and deploy again.
$ kubectl apply -f app-v2.yaml
service/my-app unchanged
deployment.apps/my-app configured
Info
Note what happens with the curl requests during the upgrade:
Host: my-app-599bdf7545-q7j42, Version: v1.0.0
curl: (7) Failed to connect to 172.17.89.232 port 30111 after 101 ms: Couldn't connect to server
curl: (28) Failed to connect to 172.17.89.232 port 30111 after 43643 ms: Couldn't connect to server
Host: my-app-7cdf7685d9-qpskd, Version: v2.0.0
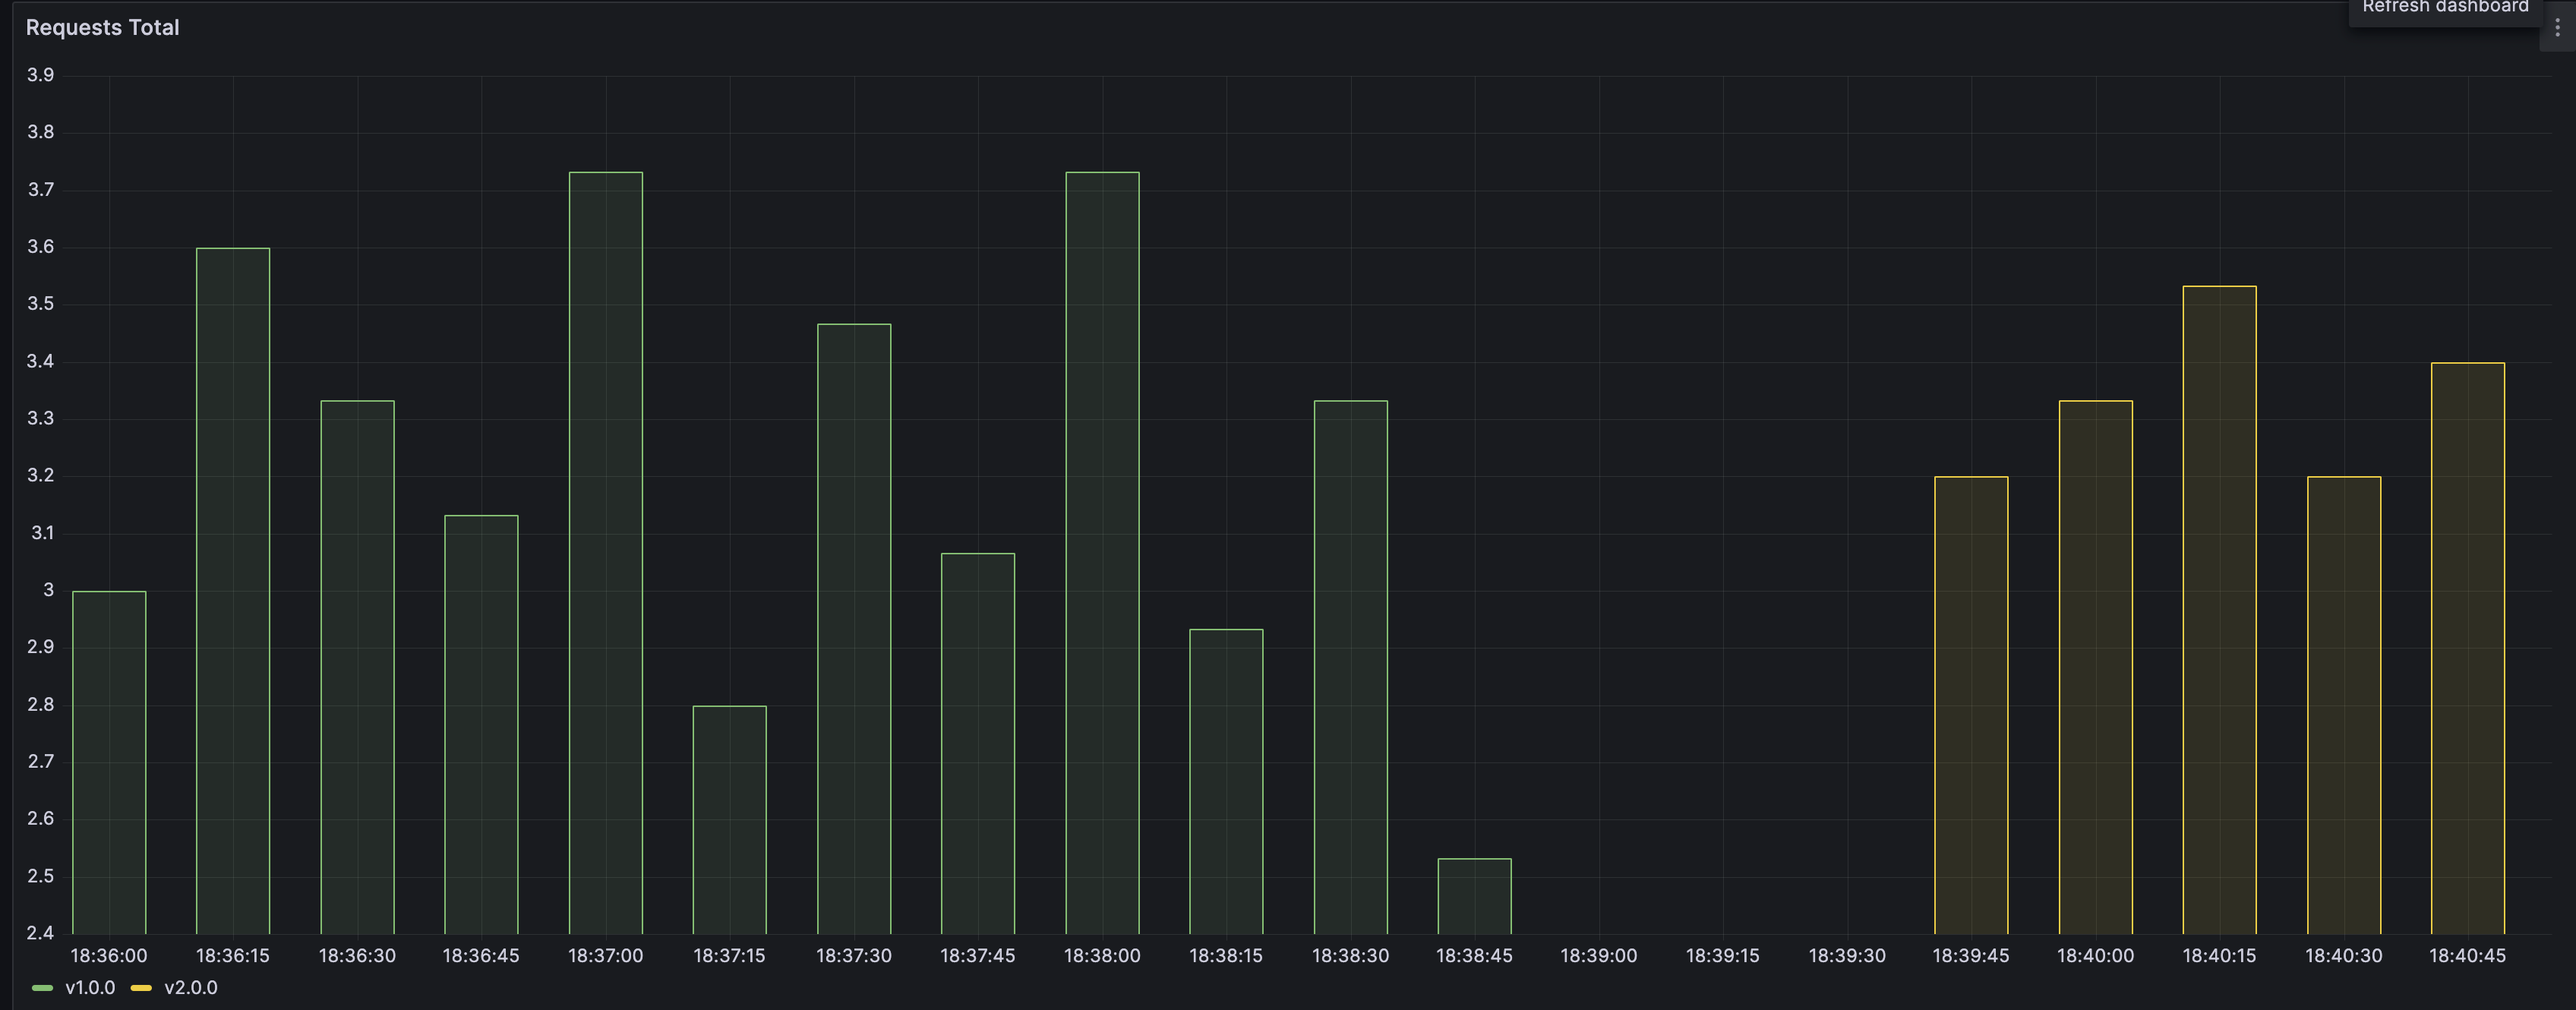
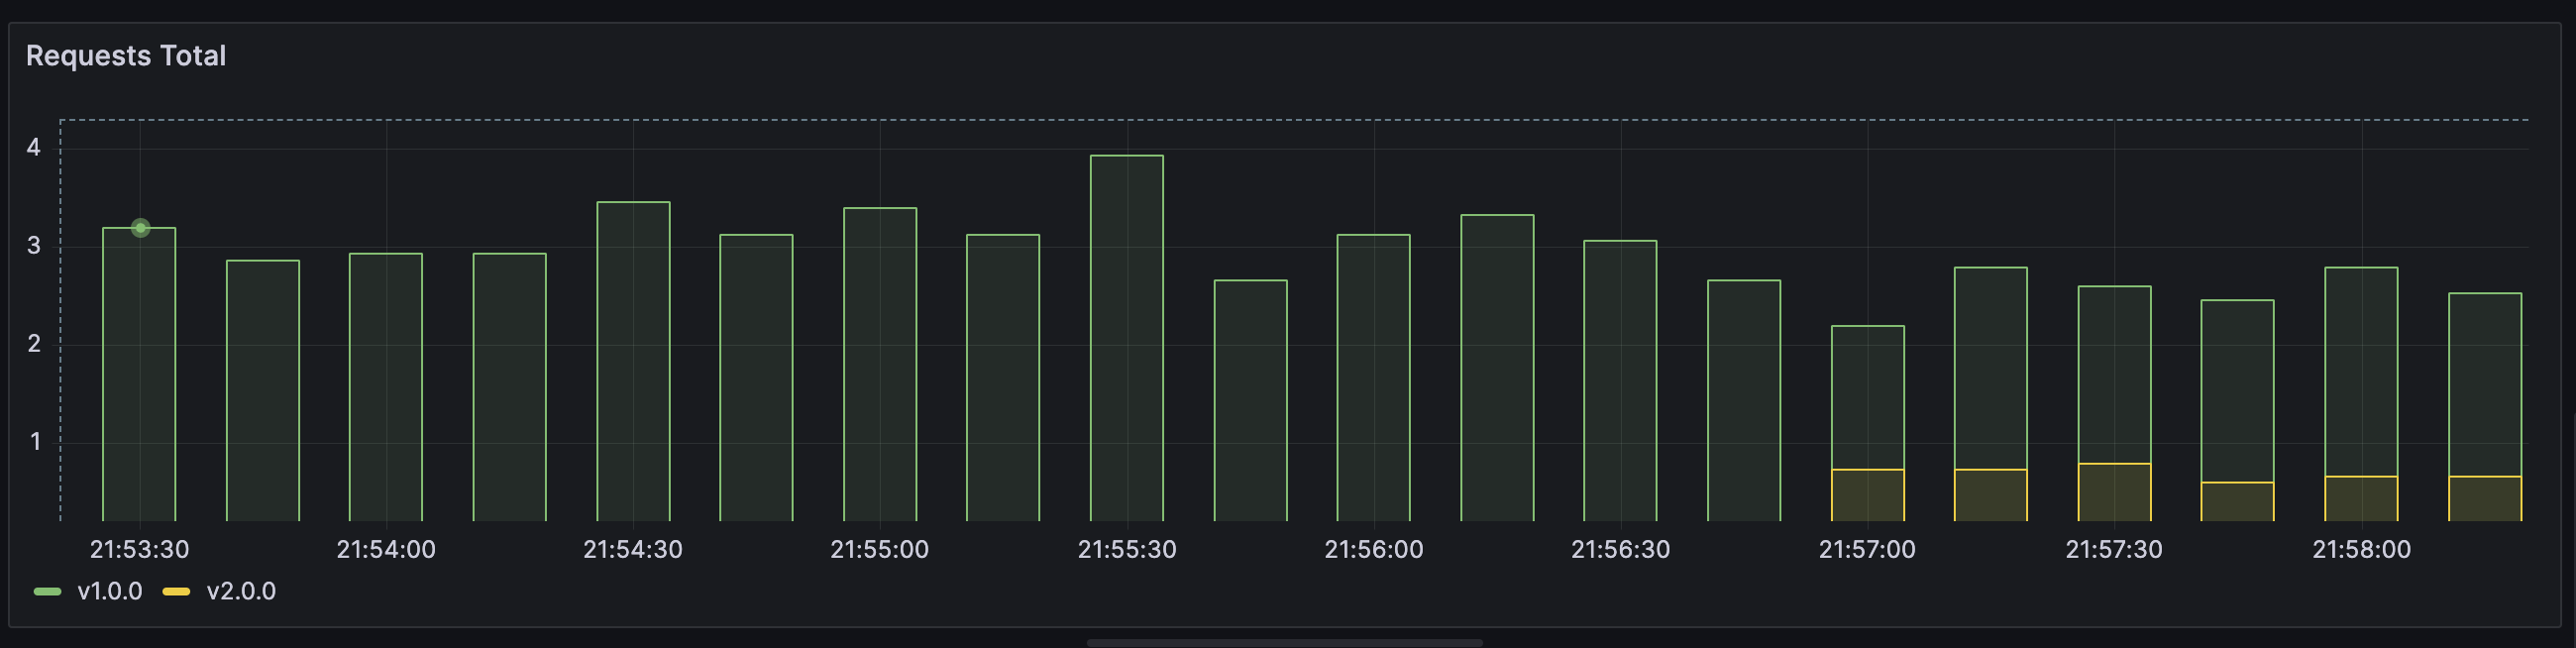
It means that such an upgrade strategy implies downtime for the service, even if scale factor is > 1.
As a result of this, your Grafana chart should show something similar to this:
Ramped strategy
We saw that plain removal and deployment of a new version leads to a downtime. However, in ideal case we want our application to be highly available at all times.
Ramped strategy is an approach where instances of a new version are gradually loading and replacing old versions.
Generally speaking there are 3 parameters that can be tuned:
- Parallelism, max batch size: Number of concurrent instances to roll out.
- Max surge: How many instances to add in addition of the current amount.
- Max unavailable: Number of unavailable instances during the rolling update procedure.
Complete
To test out Ramped strategy, adjust the v1 of the application and increase replica count to 10. Change replica count to 10 in app-v1.yaml and deploy again.
kubectl get pods | grep my-app | wc -l
10
We now have 10 "old" instances running.
Now let's edit the app-v2.yaml and replace replica count and upgrade strategy blocks:
  ...
  replicas: 10
  strategy:
    type: RollingUpdate
    rollingUpdate:
      maxSurge: 1
      maxUnavailable: 0
  ...
Run kubectl apply -f app-v2.yaml to start the upgrade. Observe curl outcome! Do you see any dropped packages? Try playing with different values of the RollingUpdate strategy and see the impact on pod replacement.
Info
# In case you discover some issue with the new version, you can undo the rollout
$ kubectl rollout undo deploy my-app

# If you can also pause the rollout if you want to run the application for a
# subset of users
$ kubectl rollout pause deploy my-app

# Then if you are satisfied with the result, resume rollout
$ kubectl rollout resume deploy my-app
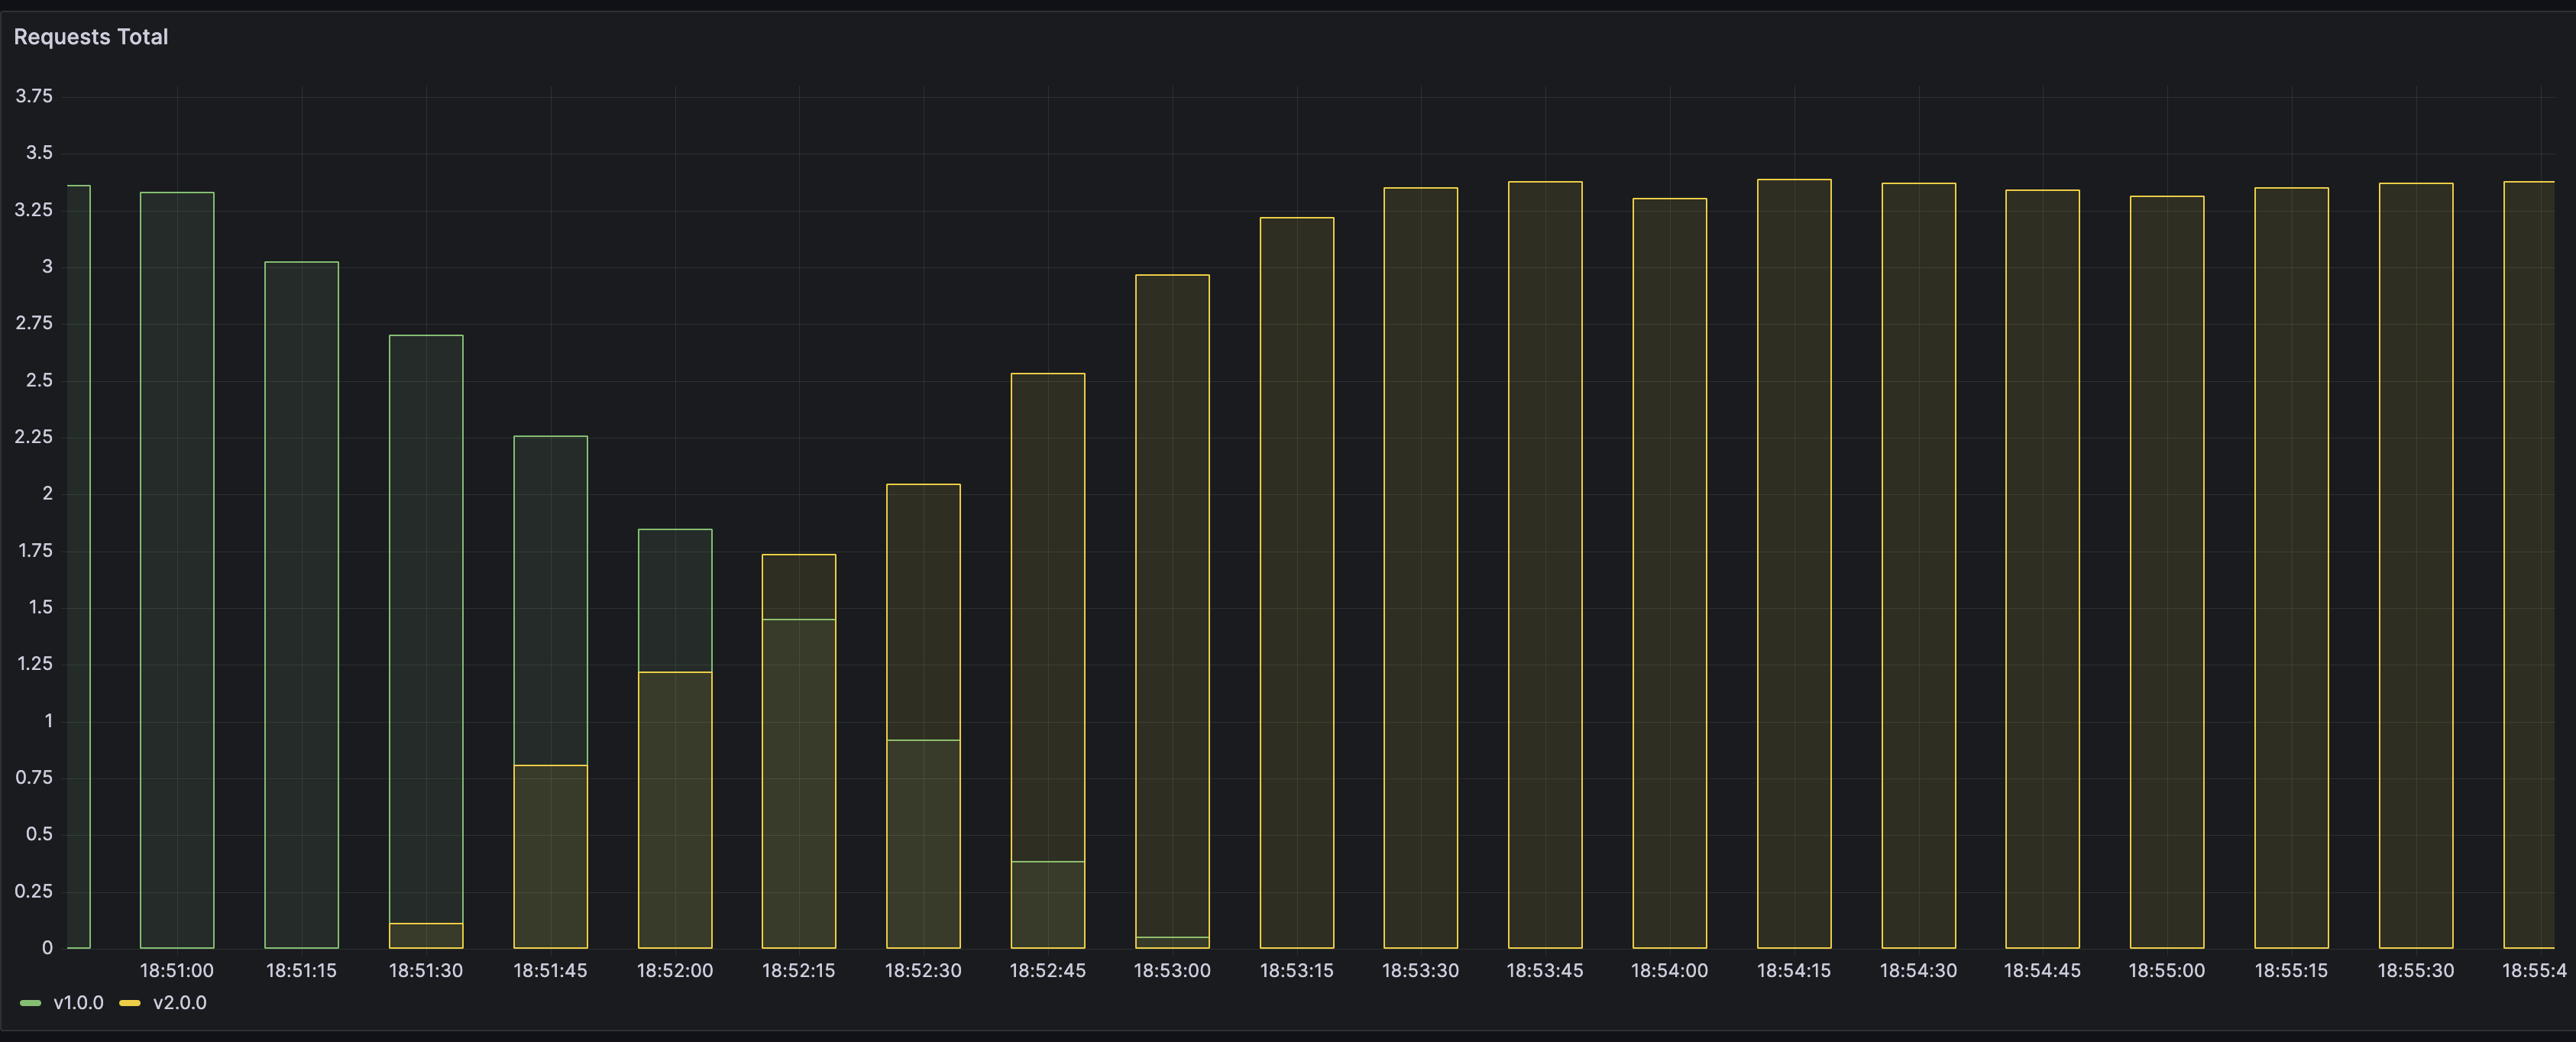
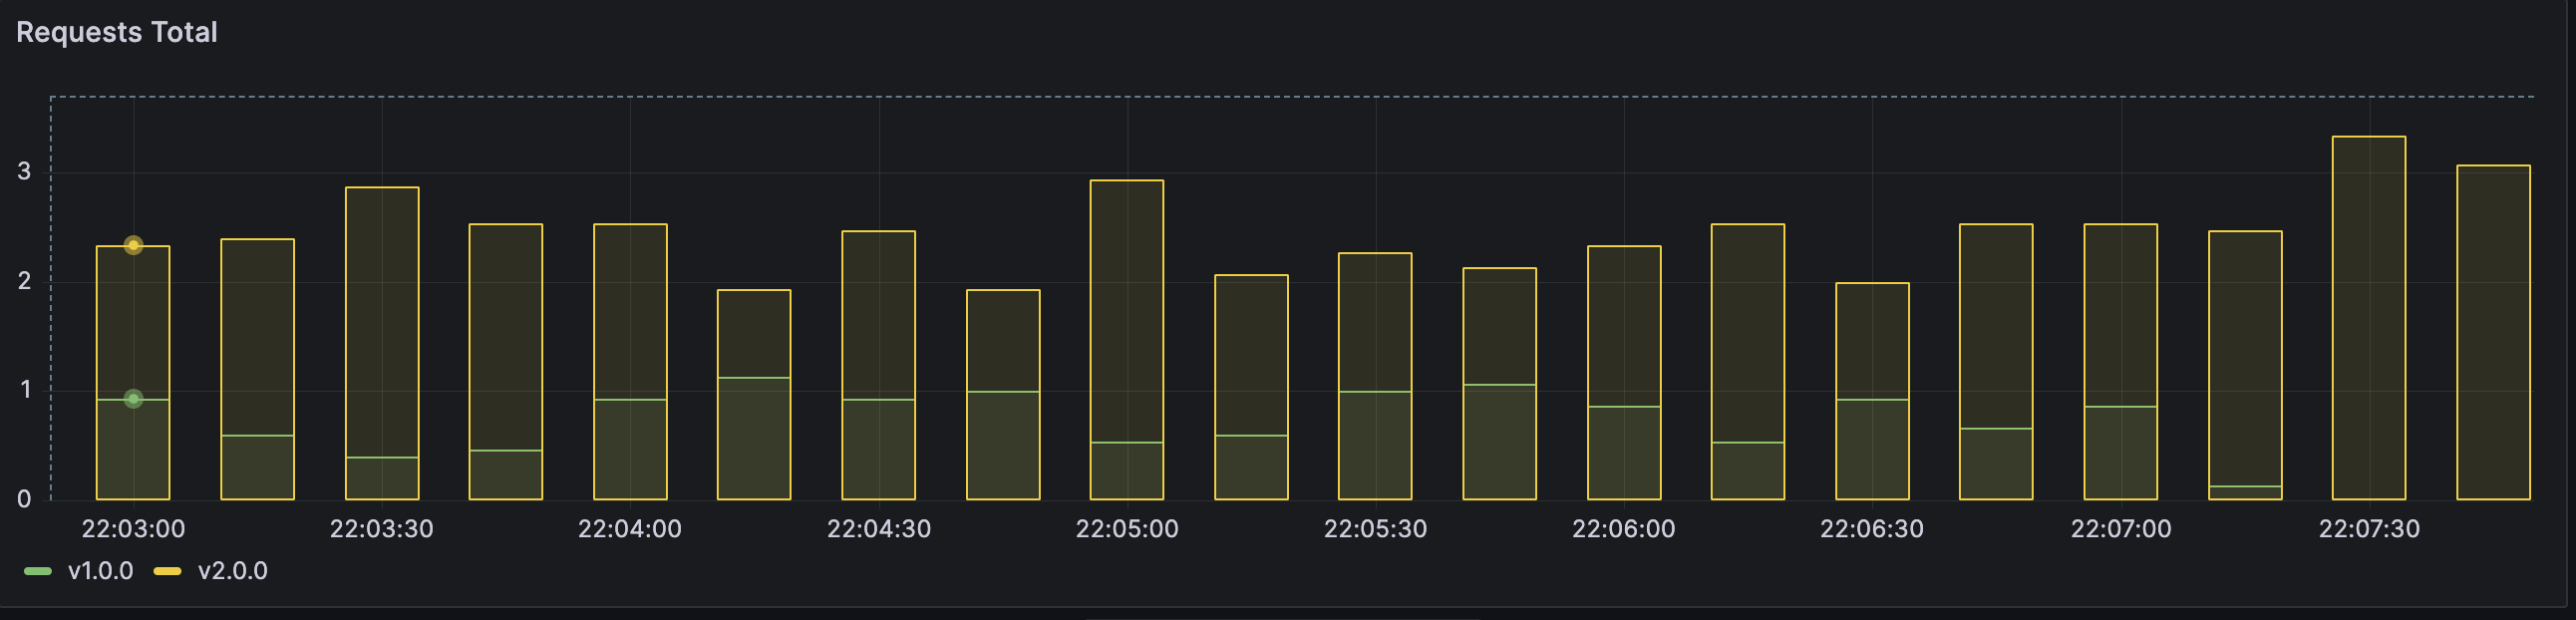
Monitoring in Grafana should also show a more gradual transition from old version to a new one.
Blue-green deployment
The blue/green deployment strategy differs from a ramped deployment, version B (green) is deployed alongside version A (blue) with exactly the same amount of instances. After testing that the new version meets all the requirements the traffic is switched from version A to version B at the load balancer level.
In this lab we shall try out an approach for blue-green update strategy using targeting of traffic flow in Service.
Complete
Let's start by creating a new manifest for v1 of the application. We need to assign a distinctive name and set metadata. We also need to adjust Service manifest and start selecting targets by version as well. For convenience, this is what you should end up with. Please save as app-v1.yaml:
apiVersion: v1
kind: Service
metadata:
  name: my-app
  labels:
    app: my-app
spec:
  type: NodePort
  ports:
  - name: http
    port: 80
    targetPort: http
    nodePort: 30111

  # Note here that we match both the app and the version
  selector:
    app: my-app
    version: v1.0.0
---
apiVersion: apps/v1
kind: Deployment
metadata:
  name: my-app-v1
  labels:
    app: my-app
spec:
  replicas: 3
  selector:
    matchLabels:
      app: my-app
      version: v1.0.0
  template:
    metadata:
      labels:
        app: my-app
        version: v1.0.0
      annotations:
        prometheus.io/scrape: "true"
        prometheus.io/port: "9101"
    spec:
      containers:
      - name: my-app
        image: containersol/k8s-deployment-strategies
        ports:
        - name: http
          containerPort: 8080
        - name: probe
          containerPort: 8086
        env:
        - name: VERSION
          value: v1.0.0
        livenessProbe:
          httpGet:
            path: /live
            port: probe
          initialDelaySeconds: 5
          periodSeconds: 5
        readinessProbe:
          httpGet:
            path: /ready
            port: probe
          periodSeconds: 5
Let's deploy the manifests and make sure that load generator works and that Grafana shows that requests are hitting only application with version 1.0.0.
Now let's deploy a new version of the application as a new deployment. Adjust versions and set them to 2.0.0. Try to do it on your own!
For reference, this is the desired outcome:
apiVersion: apps/v1
kind: Deployment
metadata:
  name: my-app-v2
  labels:
    app: my-app
spec:
  replicas: 3
  selector:
    matchLabels:
      app: my-app
      version: v2.0.0
  template:
    metadata:
      labels:
        app: my-app
        version: v2.0.0
      annotations:
        prometheus.io/scrape: "true"
        prometheus.io/port: "9101"
    spec:
      containers:
      - name: my-app
        image: containersol/k8s-deployment-strategies
        ports:
        - name: http
          containerPort: 8080
        - name: probe
          containerPort: 8086
        env:
        - name: VERSION
          value: v2.0.0
        livenessProbe:
          httpGet:
            path: /live
            port: probe
          initialDelaySeconds: 5
          periodSeconds: 5
        readinessProbe:
          httpGet:
            path: /ready
            port: probe
          periodSeconds: 5
Deploy app v2. The outcome should look like this:
# kubectl get pods | grep my-app
my-app-v1-599bdf7545-2t8sm      1/1     Running   0             7m36s
my-app-v1-599bdf7545-5wvnc      1/1     Running   0             7m36s
my-app-v1-599bdf7545-fzdfh      1/1     Running   0             7m36s
my-app-v2-7cdf7685d9-452qz      1/1     Running   0             46s
my-app-v2-7cdf7685d9-8ttps      1/1     Running   0             46s
my-app-v2-7cdf7685d9-hkx49      1/1     Running   0             46s
Check the load generator, it should only include replies from my-app-v1, for example:
Host: my-app-v1-599bdf7545-2t8sm, Version: v1.0.0
Host: my-app-v1-599bdf7545-fzdfh, Version: v1.0.0
Host: my-app-v1-599bdf7545-2t8sm, Version: v1.0.0
Host: my-app-v1-599bdf7545-2t8sm, Version: v1.0.0
Host: my-app-v1-599bdf7545-fzdfh, Version: v1.0.0
So, time to switch!
As a reminder, currently Service is using the following logic for targeting the traffic:
selector:
  app: my-app
  version: v1.0.0
What we want to do is to update selector to route traffic to version v2.0.0. We can do that by using kubectl patch.
kubectl patch service my-app -p '{"spec":{"selector":{"version":"v2.0.0"}}}'
````

Note the effect on the load generator:

```bash
...
Host: my-app-v1-599bdf7545-fzdfh, Version: v1.0.0
Host: my-app-v1-599bdf7545-2t8sm, Version: v1.0.0
Host: my-app-v2-7cdf7685d9-8ttps, Version: v2.0.0
Host: my-app-v2-7cdf7685d9-8ttps, Version: v2.0.0
...
Traffic flow switch is generally speaking immediate and without downtime.
Please note that app v1 is still running. Try now switching it back using a similar Service update.
Finish by cleaning up deployment of app v1.
Canary deployment
Canary deployment is a strategy of rollout where application traffic is split between already deployed instances and a new version. New version can be targeted for specific users, in this case strategy is also referred to as A/B testing, or can be used to gradually introduce new logic by limiting the damage it can cause by reducing the number of requests served by a new version (aka canary).
Canary deployment allows to check if new version is buggy and provides easy way of removing it from serving the load.
Let's use the same manifests as for the blue-green deployment, but adjust service and remove version from the selector. Don't forget to remove previous deployments for clean testing.
apiVersion: v1
kind: Service
metadata:
  name: my-app
  labels:
    app: my-app
spec:
  type: NodePort
  ports:
  - name: http
    port: 80
    targetPort: http
  selector:
    app: my-app
---
apiVersion: apps/v1
kind: Deployment
metadata:
  name: my-app-v1
  labels:
    app: my-app
spec:
  replicas: 3
  selector:
    matchLabels:
      app: my-app
      version: v1.0.0
  template:
    metadata:
      labels:
        app: my-app
        version: v1.0.0
      annotations:
        prometheus.io/scrape: "true"
        prometheus.io/port: "9101"
    spec:
      containers:
      - name: my-app
        image: containersol/k8s-deployment-strategies
        ports:
        - name: http
          containerPort: 8080
        - name: probe
          containerPort: 8086
        env:
        - name: VERSION
          value: v1.0.0
        livenessProbe:
          httpGet:
            path: /live
            port: probe
          initialDelaySeconds: 5
          periodSeconds: 5
        readinessProbe:
          httpGet:
            path: /ready
            port: probe
          periodSeconds: 5
After applying the manifest, we shall get 3 instances of app v1 working and processing requests. Let's now introduce 1 instance of app v2.
apiVersion: apps/v1
kind: Deployment
metadata:
  name: my-app-v2
  labels:
    app: my-app
spec:
  replicas: 1
  selector:
    matchLabels:
      app: my-app
      version: v2.0.0
  template:
    metadata:
      labels:
        app: my-app
        version: v2.0.0
      annotations:
        prometheus.io/scrape: "true"
        prometheus.io/port: "9101"
    spec:
      containers:
      - name: my-app
        image: containersol/k8s-deployment-strategies
        ports:
        - name: http
          containerPort: 8080
        - name: probe
          containerPort: 8086
        env:
        - name: VERSION
          value: v2.0.0
        livenessProbe:
          httpGet:
            path: /live
            port: probe
          initialDelaySeconds: 5
          periodSeconds: 5
        readinessProbe:
          httpGet:
            path: /ready
            port: probe
          periodSeconds: 5
Your pods should now look something like this:
$ kubectl get pods | grep my-app
my-app-v1-599bdf7545-bfjmf      1/1     Running   0             5m55s
my-app-v1-599bdf7545-k886m      1/1     Running   0             5m55s
my-app-v1-599bdf7545-z29vd      1/1     Running   0             5m55s
my-app-v2-7cdf7685d9-gxmtr      1/1     Running   0             12s
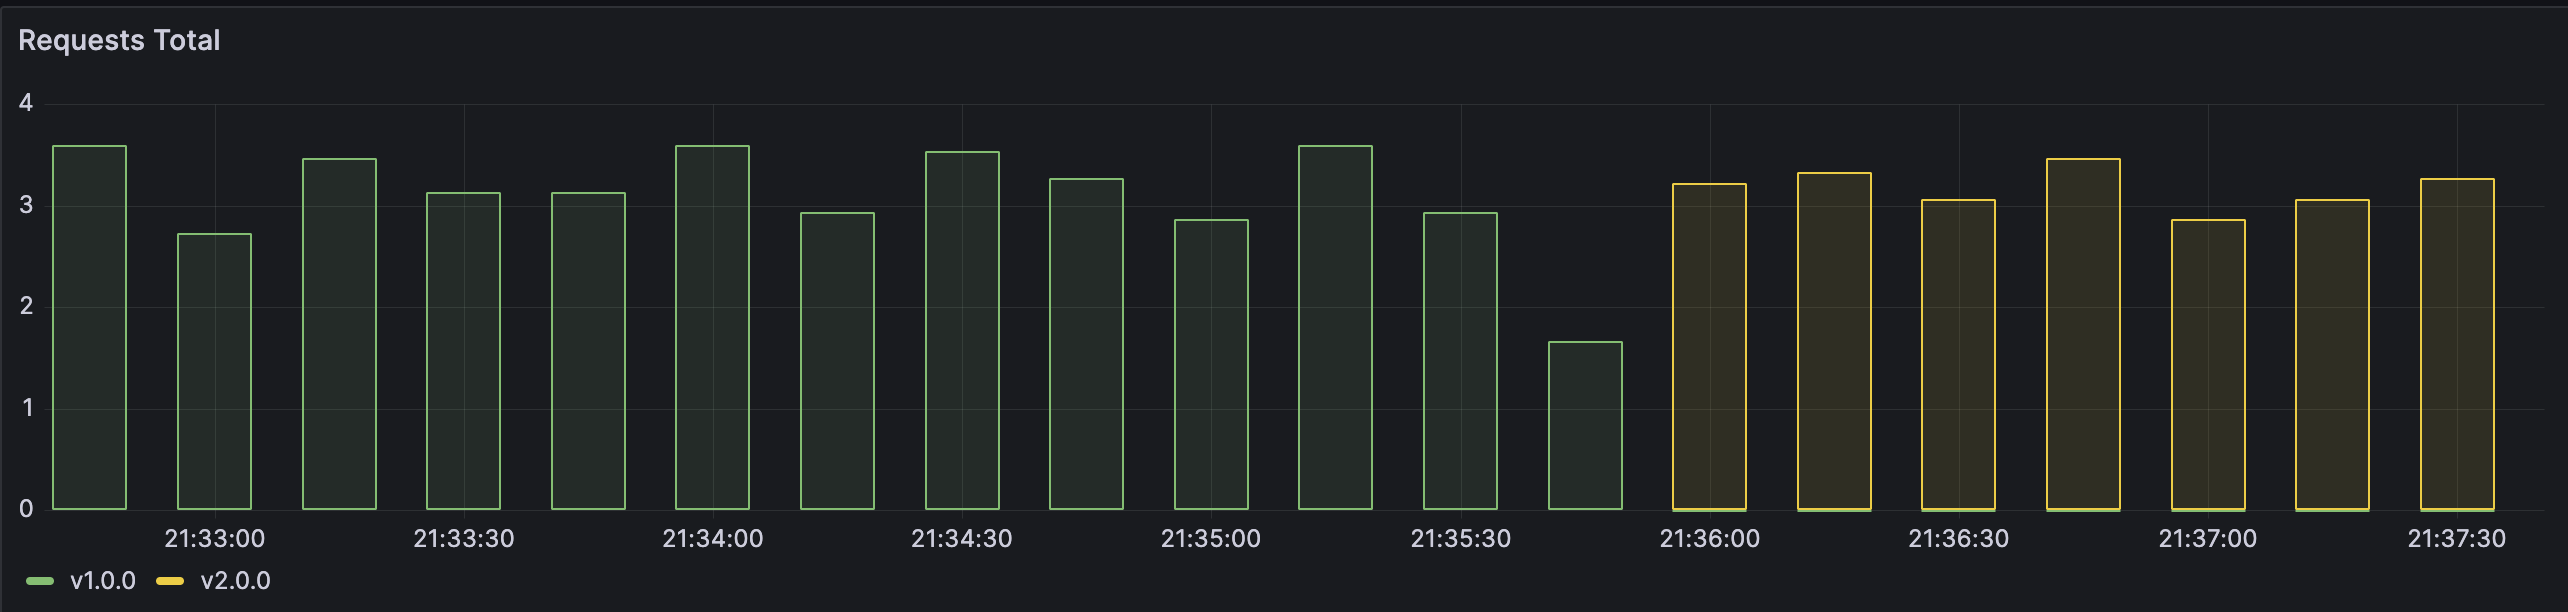
And in Grafana you can observe that traffic now reaches instances with 2 different versions. Note that ~25% of the traffic goes to a new version.
Let's image that version is OK, that is canary is alive, and let's scale v2 to 10 instances:
kubectl scale --replicas=10 deploy my-app-v2
And finally, remove the v1:
kubectl delete deployment/my-app-v1
deployment.apps "my-app-v1" deleted
A/B and shadow
There are two more strategies used for rollout: A/B testing and shadow.
A/B testing can be seen as an advanced version of canary deployment, where users are segmented based, for example, on their geolocation or configured cookies.
Shadow deployment approach consists of mirroring incoming traffic and sending it both to old version and new one, whereas requests to the new version are not used for serving the responses to users, but rather observing behaviour of real traffic on a new version.
Both of these strategies require advanced capabilities to be present in the cluster, like service mesh, and are not used with native Kubernetes tools. You are welcome to investigate them on your own.
Use case task
Verify
Application Server should become a highly available application during operations and also during the upgrades. Please extend the Electricity calculator helm package from the lab 8 and add convert it to use a ramped upgrade strategy with 3 desired replicas, of which up to 2 can be unavailable during the upgrade.
Make sure you deploy a new version of the Electricity calculator Helm package where Application Server Deployment uses the RollingUpgrade strategy. Replace the previous Electricity calculator Helm deployment in the lab8 namespace.
Danger
If you run into issues with available CPU resources on the nodes, you may have to reduce the CPU resource requirements ("requests") of some of the Deployments or Pods.
Operator framework
Kubernetes Operators are Kubernetes native applications that aim to capture (and automate) the responsibilities of "human" operators who are responsible for managing and monitoring some specific software (for example, Kafka or PostgreSQL clusters) running in Kubernetes. Operators should include everything necessary to control the full lifecycle of Kubernetes native applications, from packaging, deploying to managing (logging, upgrading, backing up, etc.). They act as a control plane for a specific Kubernetes application, often extending Kubernetes base API and implement additional custom resources.
Using the PostgreSQL operator
We will use the CloudNativePG operator for setting up PostgreSQL clusters.
CloudNativePG extends the Kubernetes API defining the following custom resources: Backup, Cluster, PoolerScheduled, Backup. You will find additional info about the API here: https://cloudnative-pg.io/documentation/1.19/cloudnative-pg.v1/.
Complete
Let's first deploy the CloudNativePG operator.
Download the CloudNativePG operator manifest:
```wget https://raw.githubusercontent.com/cloudnative-pg/cloudnative-pg/release-1.19/releases/cnpg-1.19.1.yaml```

Check the downloaded YAML file content using any file editors (for example Vim or Nano). Something to note is that
it is over 13k lines long. It includes all nessesary Kubernetes objects in a single file. We could also have used a Helm template, which separates different types of Kubernetes objects into separate template files.
Apply the downloaded template file in a usual manner using kubectl.
Verify
The Operator should be deployed in the cnpg-system namespace. Check that it was successfully deployed using the command: kubectl get deploy -n cnpg-system cnpg-controller-manager
Complete
Create a new template file for the CloudNativePG PostgreSQL cluster.
apiVersion: postgresql.cnpg.io/v1
kind: Cluster
metadata:
  name: cluster-postgresql
spec:
  instances: 2
  primaryUpdateStrategy: unsupervised # Automated updating of primary once all replicas have been upgraded
  imageName: ghcr.io/cloudnative-pg/postgresql:15.4
You should notice that the type/kind of the Kubernetes object is Cluster, which is a custom resource type implemented by the CloudNativePG Operator. Also should note that we are using a specialized API version: postgresql.cnpg.io/v1 which is the extended Kubernetes API implemented by CloudNativePG.
The number of nodes in the cluster will be 2: One Primary DB node and one secondary DB node.
This is the minimum template that is needed to set up a PostgreSQL cluster. Compared to a PostgreSQL StatefulSet we have used before, there are an extensive set of default values and behaviours built into the Operator. For example, which PostgreSQL configuration values to expose as Kubernetes Secrets, what are the default readiness and liveness probe configurations, how to initialize and configure containers, how to implement backups and upgrade software versions in a comprehensive manner, etc.
NB: Not everything is automated by default, some behaviours must be specifically enabled when the cluster is created and some activities might still be still kept manual if there is some risk involved.
Before we apply the template, let's extend the cluster configuration with some of the features we have learned in the previous labs.
Complete
Extend the PostgreSQL cluster template with additional configurations:
- Set requests and limits for Pod CPU (0.2 request and 0.5 limit) and Memory (250 MB req and 512 limit) (ref: https://cloudnative-pg.io/documentation/1.19/resource_management/)
- Configure Persistent storage for Pods: Use Longhorn storage class, ReadWriteOnce access mode and 2GB volume size (ref: https://cloudnative-pg.io/documentation/1.19/storage/)
Apply the PostreSQL cluster template using kubectl. Make sure the cluster name stays cluster-postgresql and is deployed in lab10 namespace.
Verify
Check that the deployed Pods are using correct resource limits and requests using: kubectl describe node
Check that pods are deployed on separate nodes because of anti affinity (NB! It might not be if one node is over loaded).
Check that longhorn PVs and PVC have been created.
CloudNativePG has already created authentication secrets for the PostgreSQL cluster automatically and registered them as Kubernetes secrets.
Check the lists of secrets: kubectl get secrets
PostgreSQL Operator secrets have a prefix of cluster-postgresql-
Check the content of the cluster-postgresql-app secret.
You will not be able to see the specific values of secrets, but you can see which Keys are available.
In the following labs, we will update our application server to use the new database cluster.
Building an operator
Operators can be created using Operator SDK. You are welcome to try out https://sdk.operatorframework.io/docs/building-operators/helm/quickstart/ on your own.